As of now, Sep. 11th, 2018, Hurricane Florence (Category 4) is approaching to eastern coastal areas of United States. There are many ways to track the path of hurricanes (or typhoons) to conduct further analysis, such as flash flooding, ocean surge and property damages. In this blog, the author tries to plot the tracking of hurricanes, using both stastic and animated maps, with the help of R and related packages. Specifically, this blog is a reproducible output. Codes, data and other materials are available via my Github rep.
Import packages and data
require(gganimate)
require(tidyverse)
require(lubridate)
require(ggmap)
require(mapdata)
require(maps)

# import data hosted in my github rep.
typhoon_data <- read.csv("https://raw.github.com/wenlong-liu/typhoon_animation/master/Data/typhoon_doksuri.csv")
Data cleaning
Further data cleaning is needed to reformat the datetime and rename a column.
tracks <-  typhoon_data %>%
  # reforamt date time using lubridate package.
  mutate(time = mdy_hm(time)) %>%
  # rename columns.
  rename(long = lng)
Drawing the static tracking map
The following graph demonstrated the tracking of Typhoon Doksuri in Asia. Typhoon Doksuri was a strong typhoon that mostly impacted the Philippines and Vietnam during mid-September 2017. On Sep. 11, 2017, Dokuri landed on Philippines and caused considerable damages. Afterwards, Dokuri kept moving west towards Vietnam and considered as the “most powerful storm in a decade”. In Vietnam, Doksuri caused the depth of 15 persons with 200 people injured. Additionally, the total damages of Doksuri were estimated about US $792 million (Source).
tracks_box <- make_bbox(lon = tracks$long, lat = tracks$lat, f = 0.5)
sq_map <- get_map(location = tracks_box, maptype = "satellite", source = "google", zoom = 5)

p <- ggmap(sq_map) +
  geom_point(data = tracks, mapping = aes(x = long, y = lat, color = pressure)) +
  geom_line(data = tracks, mapping = aes(x = long, y = lat, color = pressure)) +
  scale_color_continuous(name = "Pressure(hPa)",low = "yellow", high = "red")+
  labs(title = "Tracking of Typhoon Doksuri happened in 2017",
       subtitle = paste("Max. Wind Speed:", max(tracks$speed),"m/s, Cat.",
                        max(tracks$power),"Typhoon"),
       x = "Longitude", y = "Latitude",
       caption = "Data Source: jswater.jiangsu.gov.cn")+
  NULL
p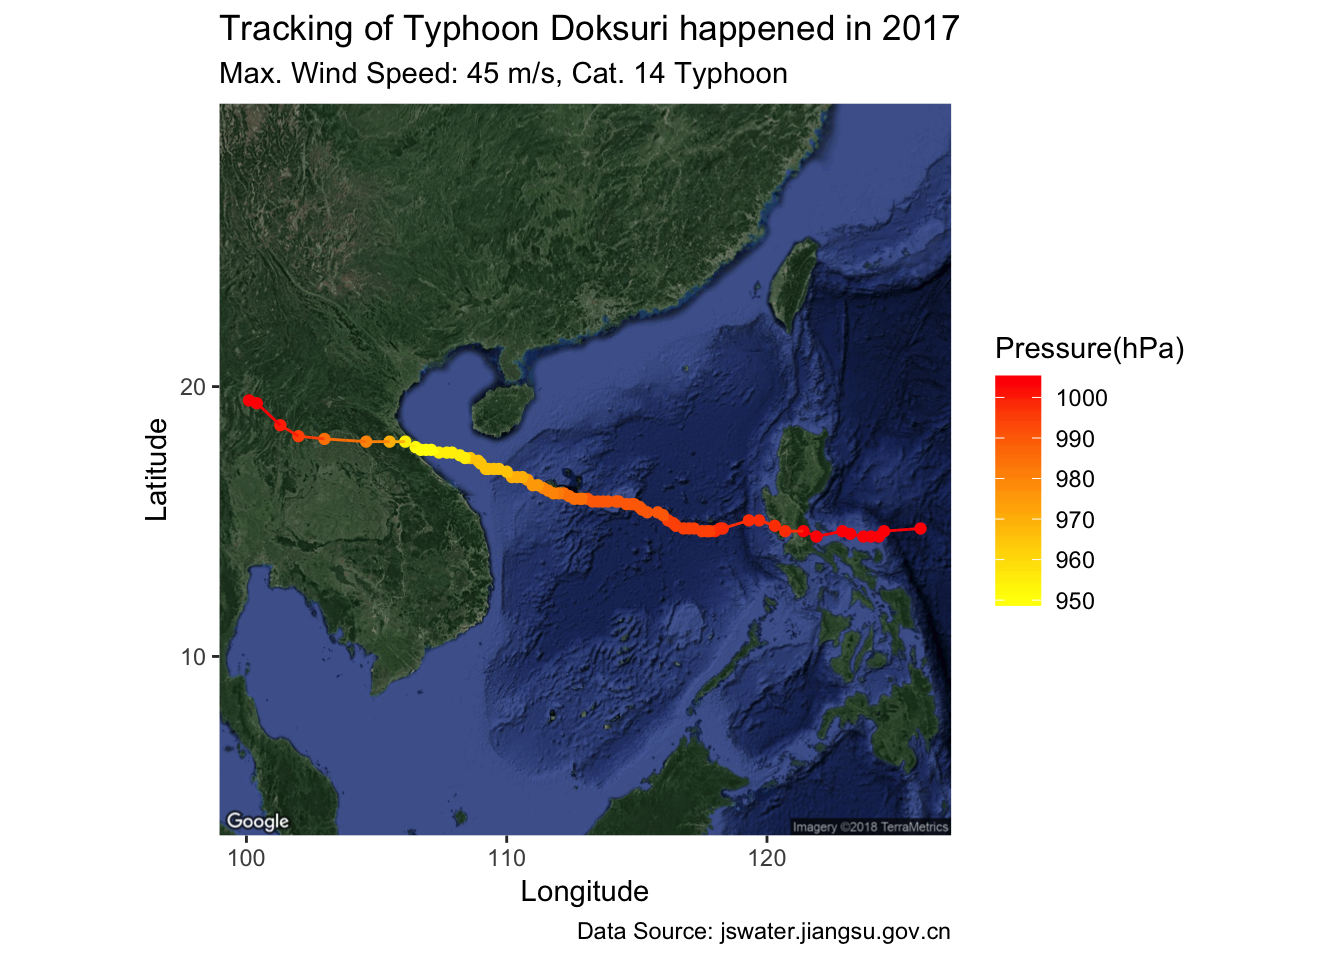
Drawing animated tracking map
Based on the previous stastic map, the author also drew an animated trakcing map using gganimate. In the subtitle of the plot, a real-time clock was added to show the timeline of the tracking path. In addition, to embed the animation in rmarkdown files, the author use specific parameters in ?gganimate::animate to pick the proper render method.
ani <- ggmap(sq_map) +
  theme(text = element_text(size = 17))+
  geom_point(data = tracks, mapping = aes(x = long, y = lat, color = pressure)) +
  geom_line(data = tracks, mapping = aes(x = long, y = lat, color = pressure), size = 2) +
  scale_color_continuous(name = "Pressure(hPa)",low = "yellow", high = "red")+
  labs(title = "Tracking of Typhoon Doksuri happened in 2017",
       subtitle = "Time:{frame_time}",
       x = "Long", y = "Lat",
       caption = "Data Source: jswater.jiangsu.gov.cn")+
   transition_reveal(1,time)+
  NULL
# embed the animation in rmarkdown.
animate(ani, renderer = ffmpeg_renderer())
Saving animation into gif files
We can also save the animation into gif files, instead of embedding the animation.
gif_ani = animate(ani)
anim_save("doksuri_tracking.gif", animation = gif_ani)
Summaries
R and related packages are able to conveniently draw both static and animated maps for tracking hurricanes or typhoons. Further analysis, such as real-time tracking of hurricanes, will be conducted in the future.
R session
sessionInfo()## R version 3.5.0 (2018-04-23)
## Platform: x86_64-apple-darwin15.6.0 (64-bit)
## Running under: macOS High Sierra 10.13.6
##
## Matrix products: default
## BLAS: /Library/Frameworks/R.framework/Versions/3.5/Resources/lib/libRblas.0.dylib
## LAPACK: /Library/Frameworks/R.framework/Versions/3.5/Resources/lib/libRlapack.dylib
##
## locale:
## [1] en_US.UTF-8/en_US.UTF-8/en_US.UTF-8/C/en_US.UTF-8/en_US.UTF-8
##
## attached base packages:
## [1] stats graphics grDevices utils datasets methods base
##
## other attached packages:
## [1] bindrcpp_0.2.2 mapdata_2.3.0 maps_3.3.0
## [4] ggmap_2.6.1 lubridate_1.7.4 forcats_0.3.0
## [7] stringr_1.3.1 dplyr_0.7.6 purrr_0.2.5
## [10] readr_1.1.1 tidyr_0.8.1 tibble_1.4.2
## [13] tidyverse_1.2.1 gganimate_0.9.9.9999 ggplot2_3.0.0
##
## loaded via a namespace (and not attached):
## [1] Rcpp_0.12.18 lattice_0.20-35 prettyunits_1.0.2
## [4] png_0.1-7 assertthat_0.2.0 rprojroot_1.3-2
## [7] digest_0.6.15 R6_2.2.2 cellranger_1.1.0
## [10] plyr_1.8.4 backports_1.1.2 evaluate_0.10.1
## [13] httr_1.3.1 blogdown_0.6 pillar_1.2.3
## [16] RgoogleMaps_1.4.2 rlang_0.2.2 progress_1.2.0
## [19] lazyeval_0.2.1 readxl_1.1.0 rstudioapi_0.7
## [22] geosphere_1.5-7 gifski_0.8.3 rmarkdown_1.10
## [25] labeling_0.3 proto_1.0.0 munsell_0.5.0
## [28] broom_0.5.0 compiler_3.5.0 modelr_0.1.2
## [31] xfun_0.2 base64enc_0.1-3 pkgconfig_2.0.1
## [34] htmltools_0.3.6 tidyselect_0.2.4 bookdown_0.7
## [37] crayon_1.3.4 withr_2.1.2 grid_3.5.0
## [40] nlme_3.1-137 jsonlite_1.5 gtable_0.2.0
## [43] magrittr_1.5 scales_1.0.0 cli_1.0.0
## [46] stringi_1.2.4 farver_1.0 mapproj_1.2.6
## [49] reshape2_1.4.3 sp_1.3-1 xml2_1.2.0
## [52] rjson_0.2.20 tools_3.5.0 glue_1.3.0
## [55] tweenr_0.1.5.9999 hms_0.4.2 jpeg_0.1-8
## [58] yaml_2.1.19 colorspace_1.3-2 rvest_0.3.2
## [61] knitr_1.20 bindr_0.1.1 haven_1.1.2